Report Layout
💡 Predefined data summaries for quick insights and analysis.
Standard Reports display tables and visualisations of aggregate data within a record. This guide explains how to create and manage reports, configure widgets, and use features such as filters, search, and download.
Creating a Report
Step 1. Add a Report
- Select Settings > System Settings from the side navigation menu.
- Open the Reports and Dashboard menu.
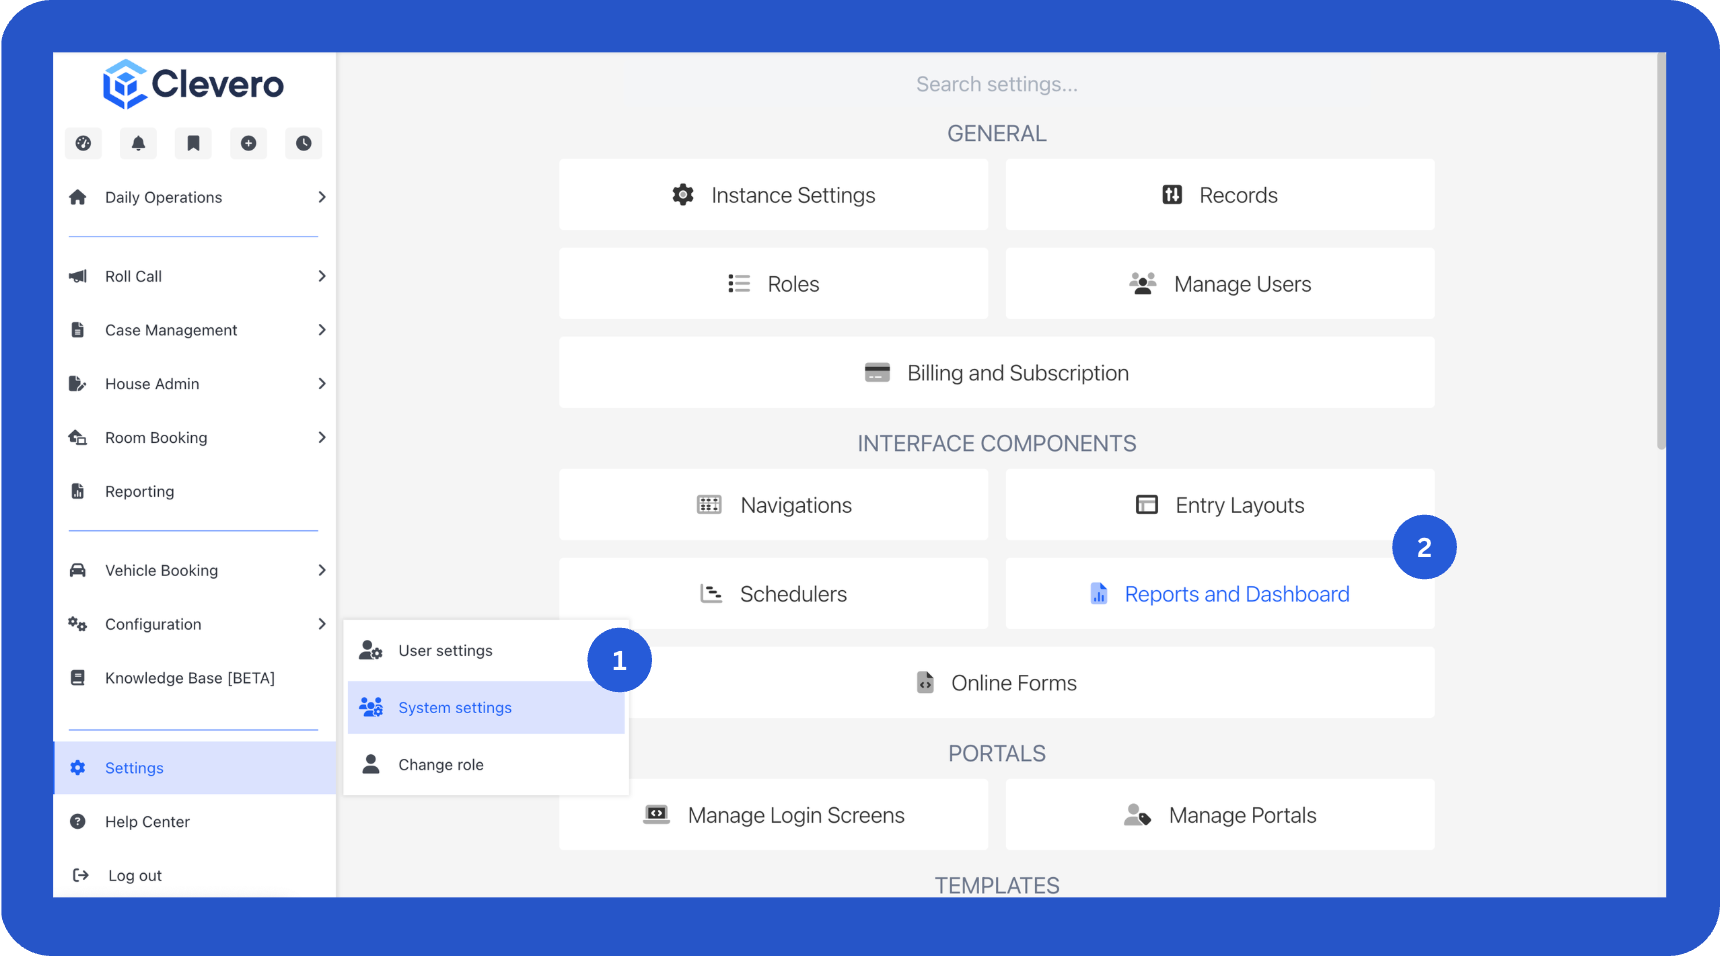
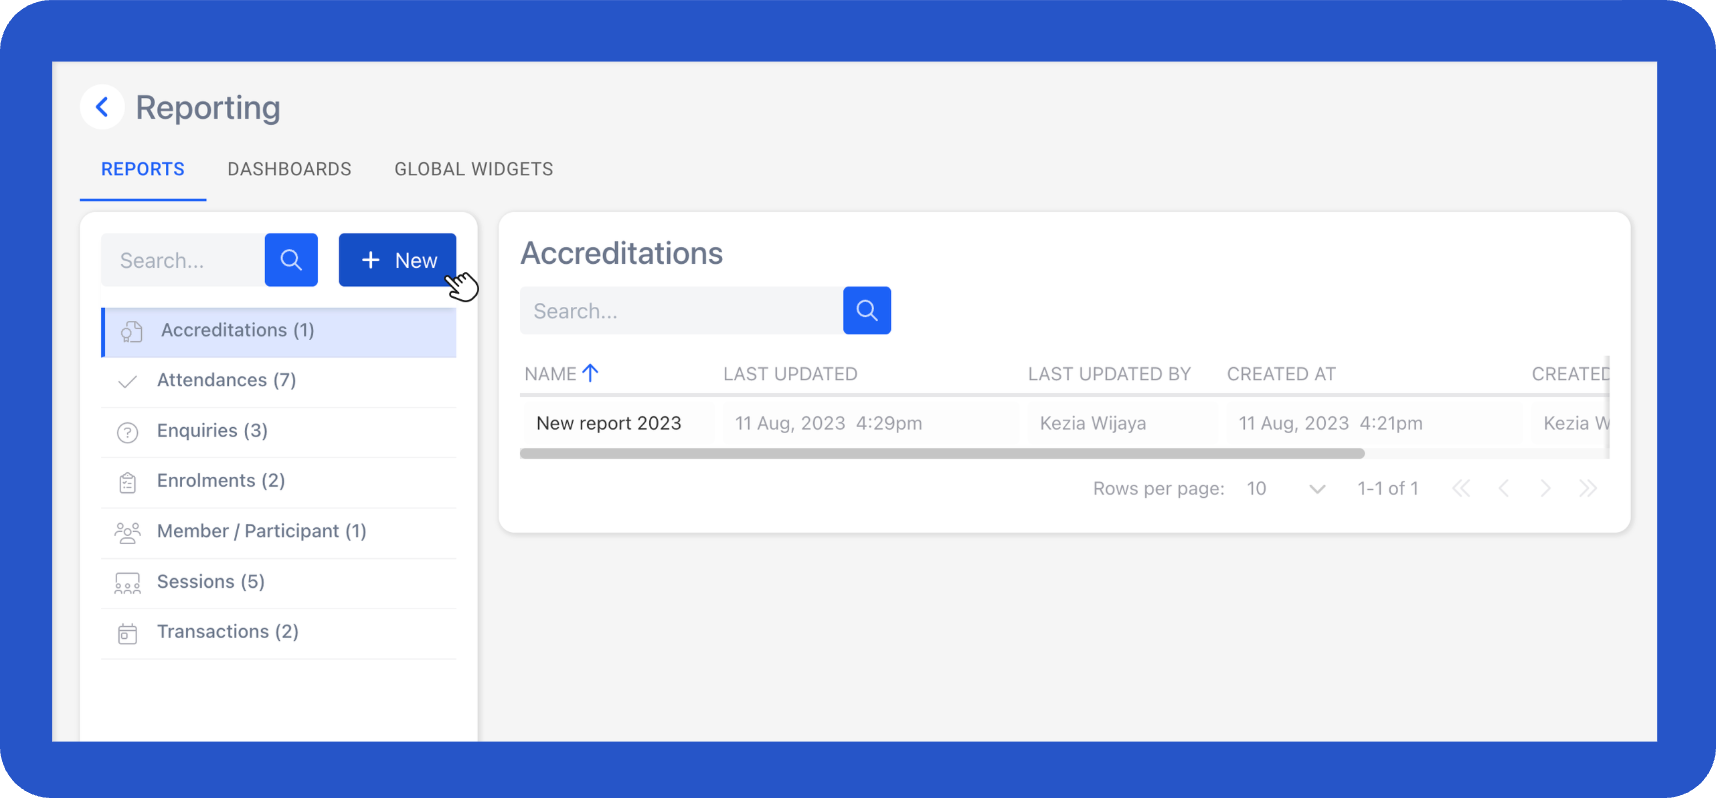
- Click + New to create a new report.
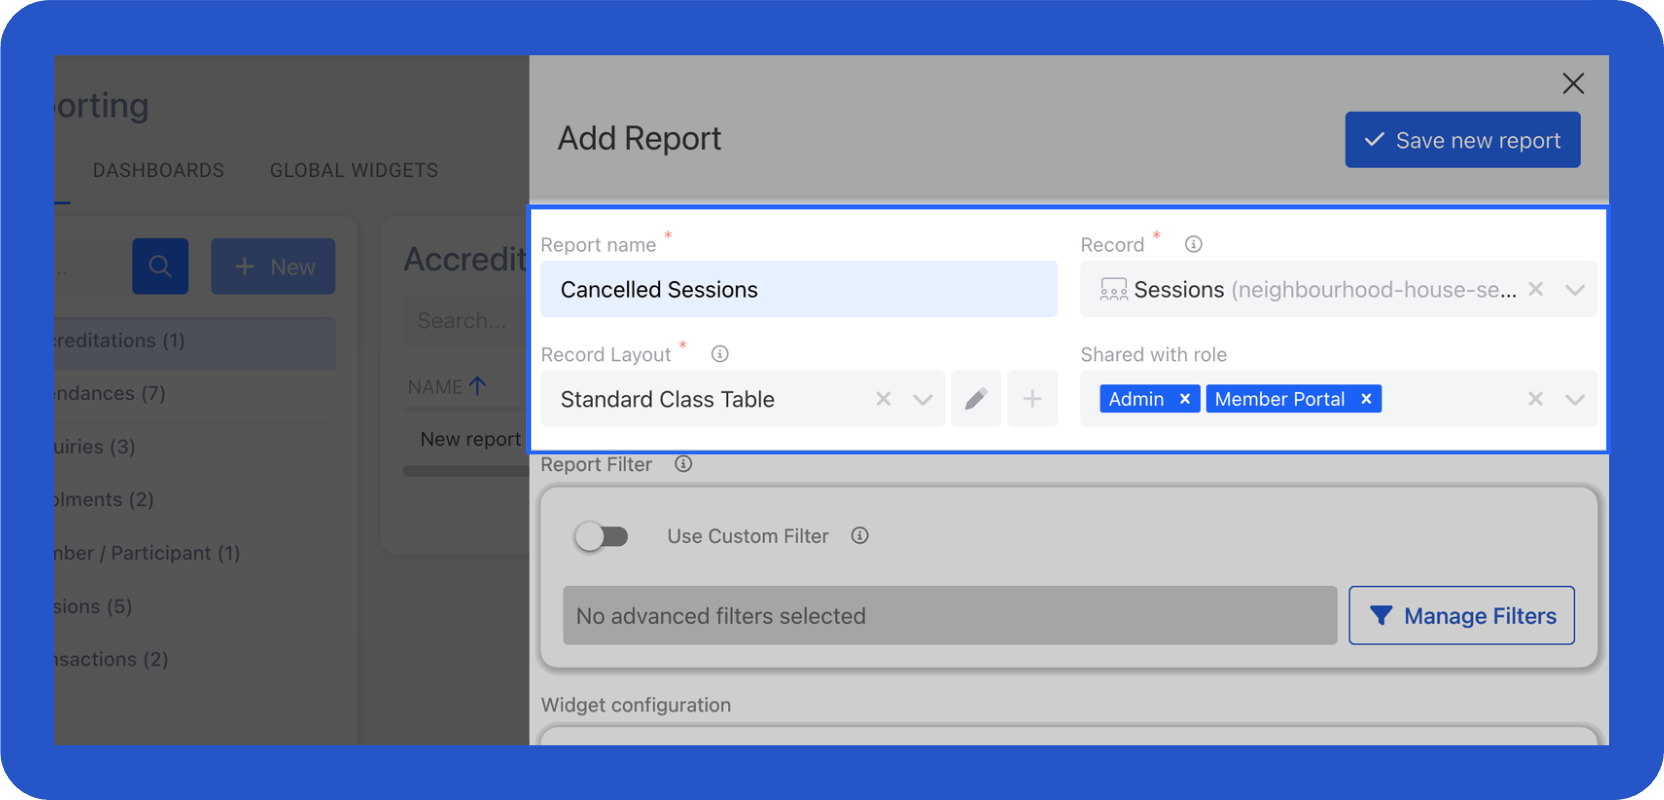
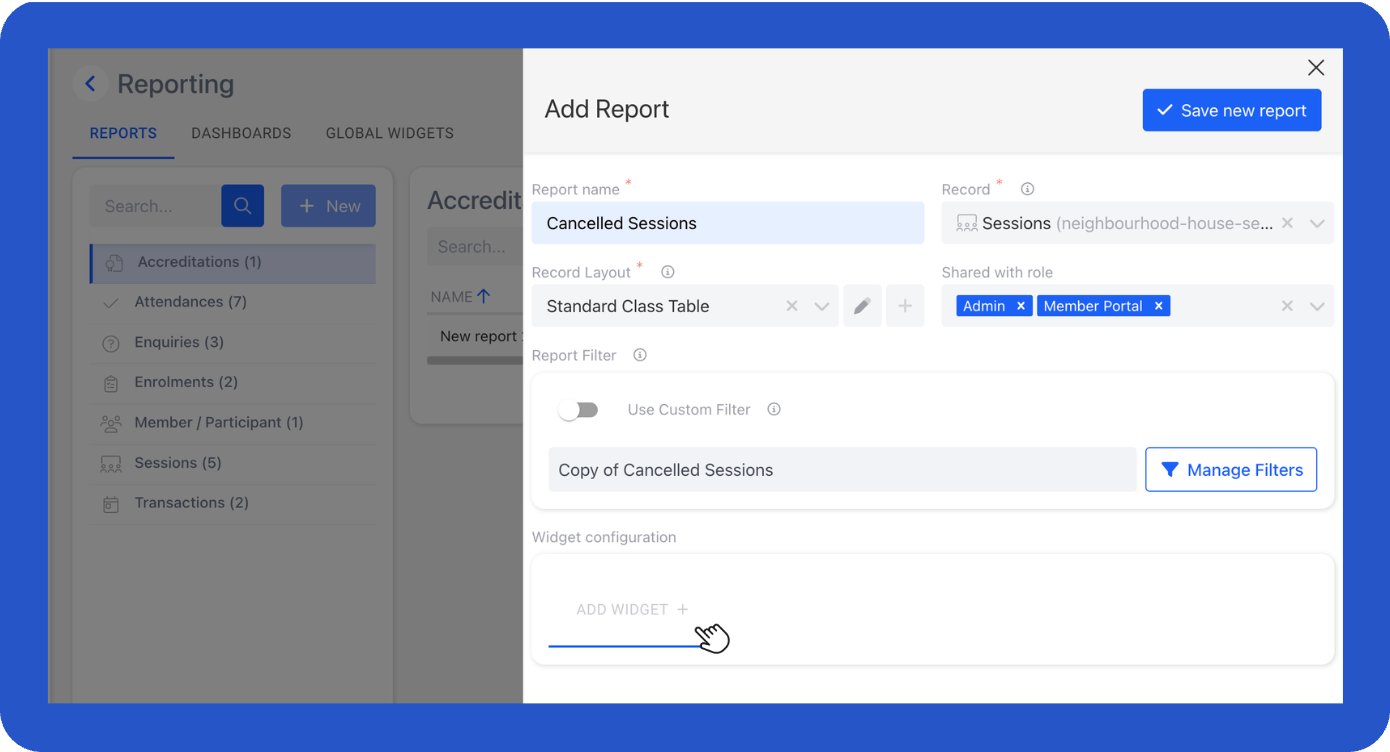
- Fill in the general information:
- Enter the report name.
- Select the record that will be the data source for the report.
- Choose the record layout that will be the report’s default view. You can:
- Select an existing layout from the record, or
- Create a new layout by clicking the + icon. For details, see Views and Layouts
- In Shared with Roles, select the users who can view the report.
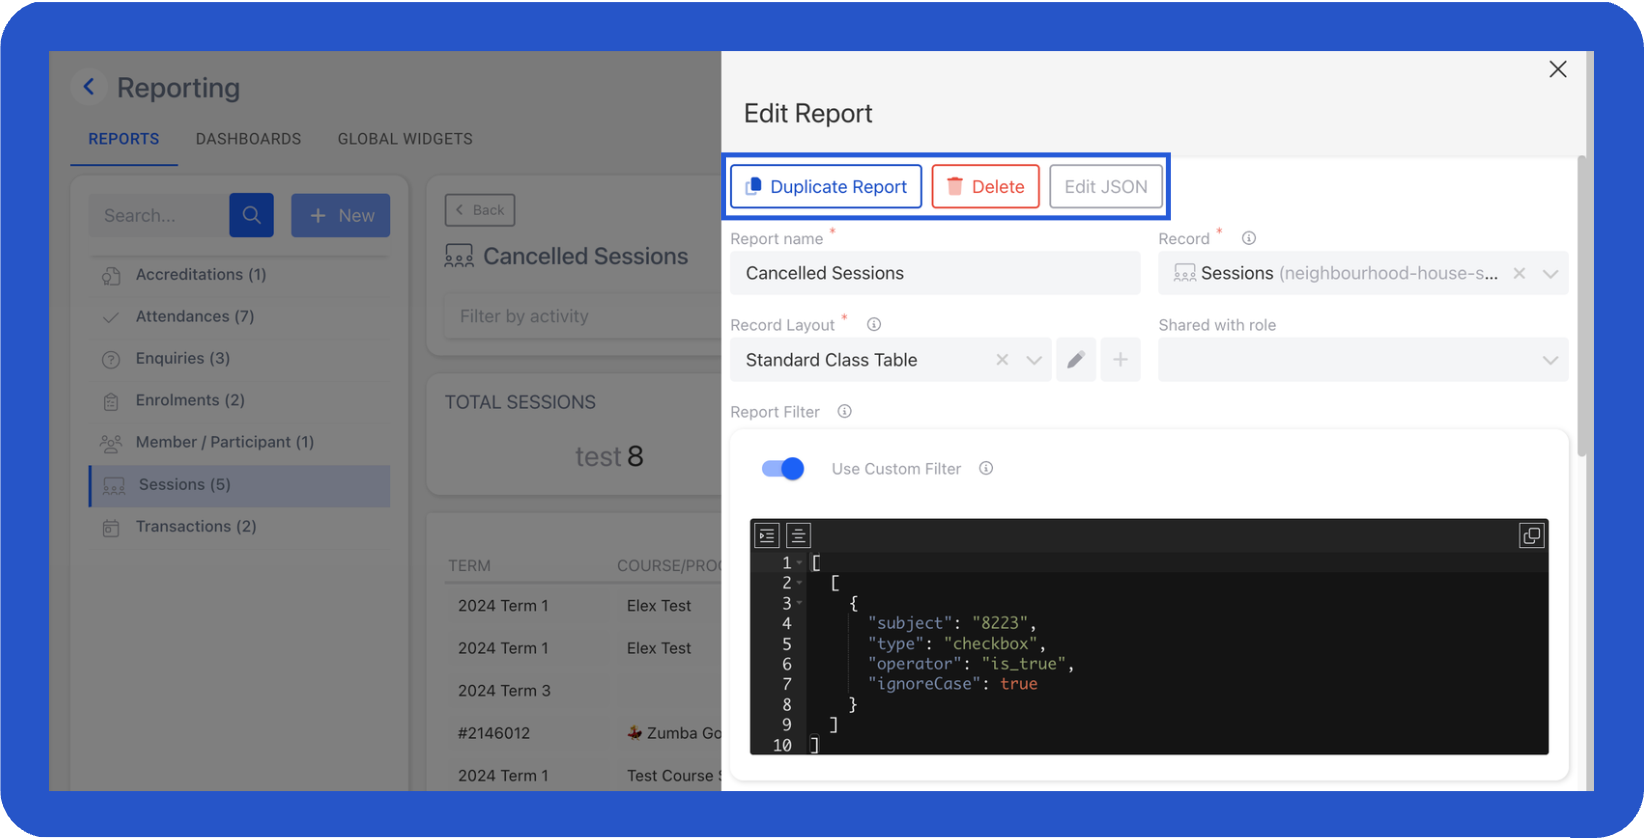
Step 2. Set Up Filters
Set up filters to control which records appear in your report. You can use either a custom JSON filter or an advanced filter from the selected record.
Custom Filter
Enable Use Custom Filter. A code block will appear where you can enter a JSON snippet with your filter conditions.
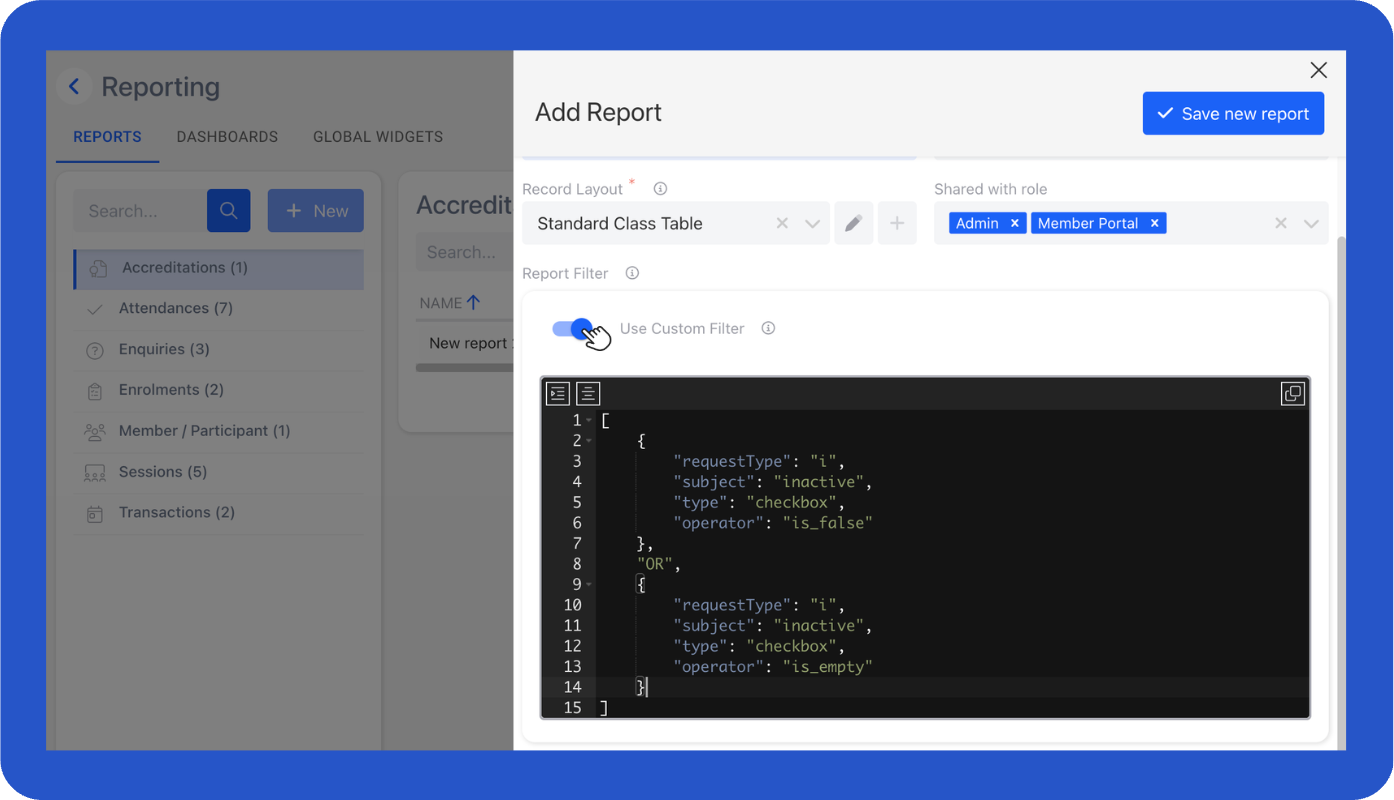
For example:
[
    {
        "requestType": "i",
        "subject": "inactive",
        "type": "checkbox",
        "operator": "is_false"
    },
    "OR",
    {
        "requestType": "i",
        "subject": "inactive",
        "type": "checkbox",
        "operator": "is_empty"
    },
    "OR",
    {
        "requestType": "i",
        "subject": "inactive",
        "type": "general",
        "operator": "not_exists"
    }
]
This example filters entries based on three conditions:
- Condition 1 – The entry is not marked as inactive.
- Condition 2 – The inactive field is empty.
- Condition 3 – The inactive field does not exist.
Advanced Filter
Disable Use Custom Filter, then select an advanced filter from the list. These filters come from the record you selected.
Info:To create an advanced filter, refer to Advance Filters.
Step 3. Configure Widgets
Widgets let you display aggregated values (totals, averages, grouped counts, etc.) in your report.
- Select Add Widget +
- Fill in the widget details:
Fields | Description |
|---|---|
Title | The title shown on the widget. |
Title Position | Specify the position where the title appears (top or bottom). |
Title Alignment | Specify the horizontal alignment of the title (left, centre, right). |
Type | The widget type, e.g., count, sum, grouped count, average. |
Prefix/Suffix | Text shown before or after the value. For example:
|
Number Format | Formats numbers using commas (default: en-US). |
Decimal | Enable decimals or round to the nearest whole number. If enabled, set the minimum and maximum decimal places to show. |
Text Size | Size of the value text:
Note: Any decimal value (min 0.1) is valid here. |
Text Color | Color of the number displayed in the widget. |
Icon | Icon displayed before the value. |
Icon Color | Colour of the icon. |
-
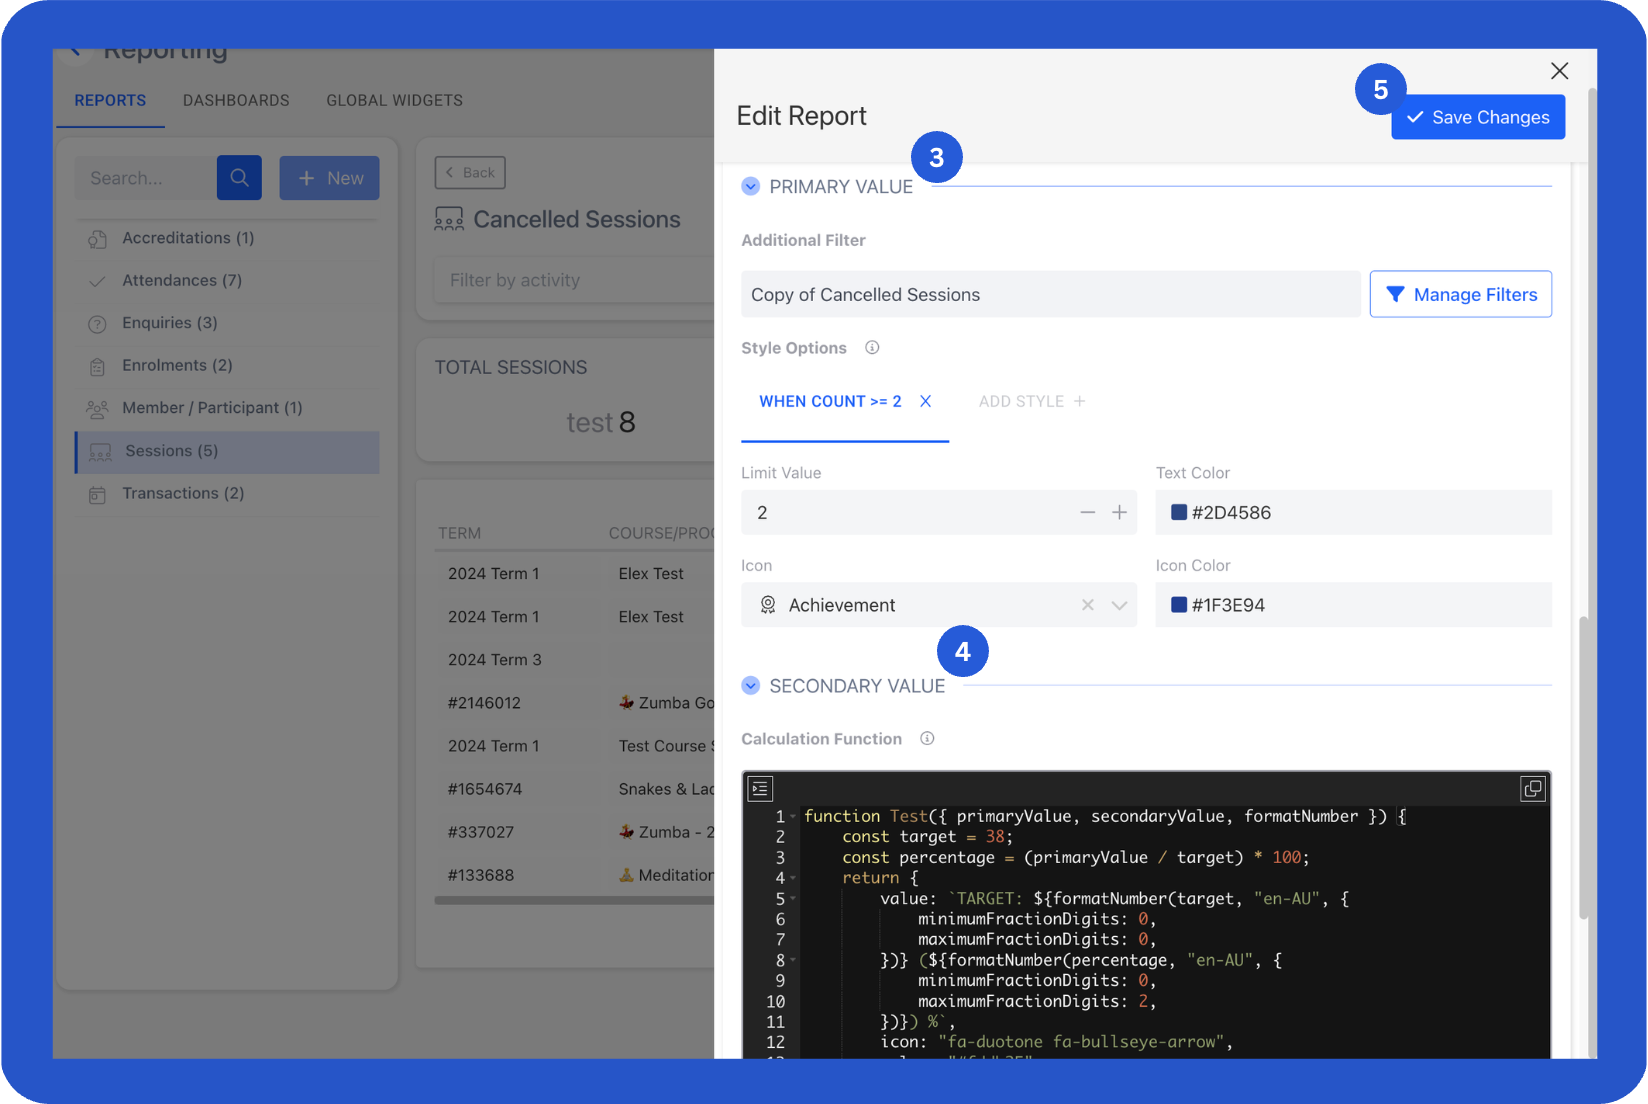
Configure the Primary Value information:
- Additional Filter, an extra filter for this widget.
- Style Options (Optional), change text or icon colour based on value limits.
- Limit Value: Limit the value you want to show.
- Text Color: Color of the number.
- Icon: The icon is displayed before the value.
- Icon Color: Color of the icon.
-
Configure the Secondary Value information. You can set the Calculation Function to display both primary and secondary values, or calculate new values.
For example, use a custom calculation function to compare actual hours (
primaryValue) against the weekly target. The example below sets a weekly target of38 hoursand calculates the completion percentage.
function Test({ primaryValue, secondaryValue, formatNumber }) {
    const target = 38;
    const percentage = (primaryValue / target) * 100;
    return {
        value: `TARGET: ${formatNumber(target, "en-AU", {
            minimumFractionDigits: 0,
            maximumFractionDigits: 0,
        })} (${formatNumber(percentage, "en-AU", {
            minimumFractionDigits: 0,
            maximumFractionDigits: 2,
        })}) %`,
        icon: "fa-duotone fa-bullseye-arrow",
        color: "#fddb25",
        size: "sm",
    };
}- Click Save New Report to save your configuration.
Report Features
Search and Filter
Use the search bar and filters to find specific data in your report.
Download the report
Download the report in CSV format.
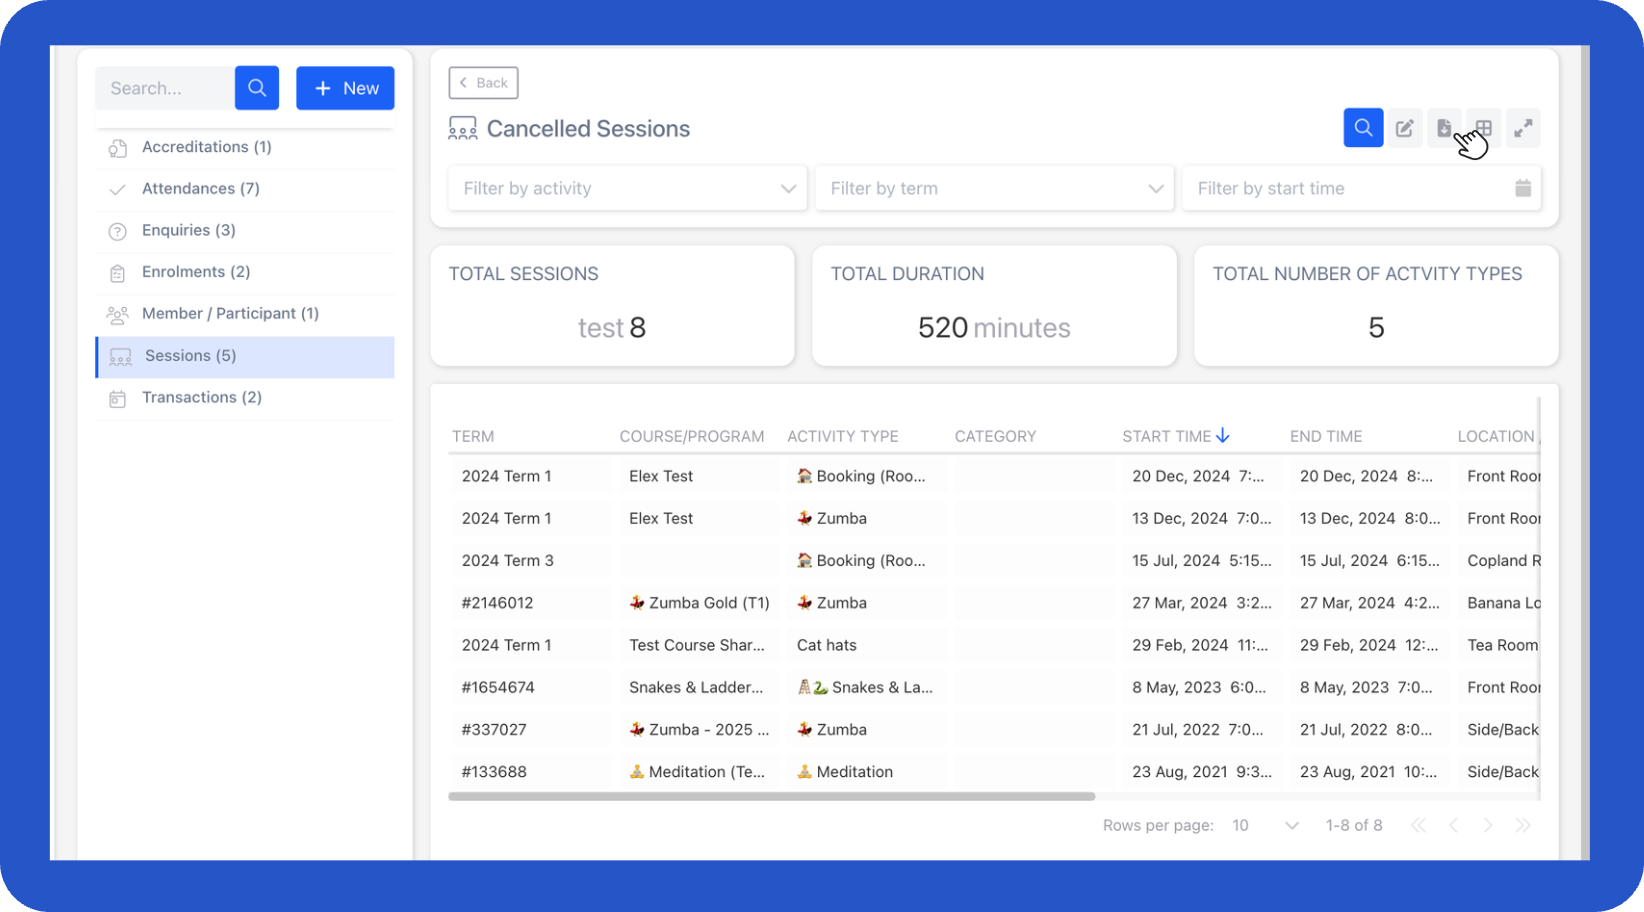
NoteYou can also download the report after applying filters.
Change the layout
Switch the report view by selecting a different layout.
Edit the layout
Select the Edit button.
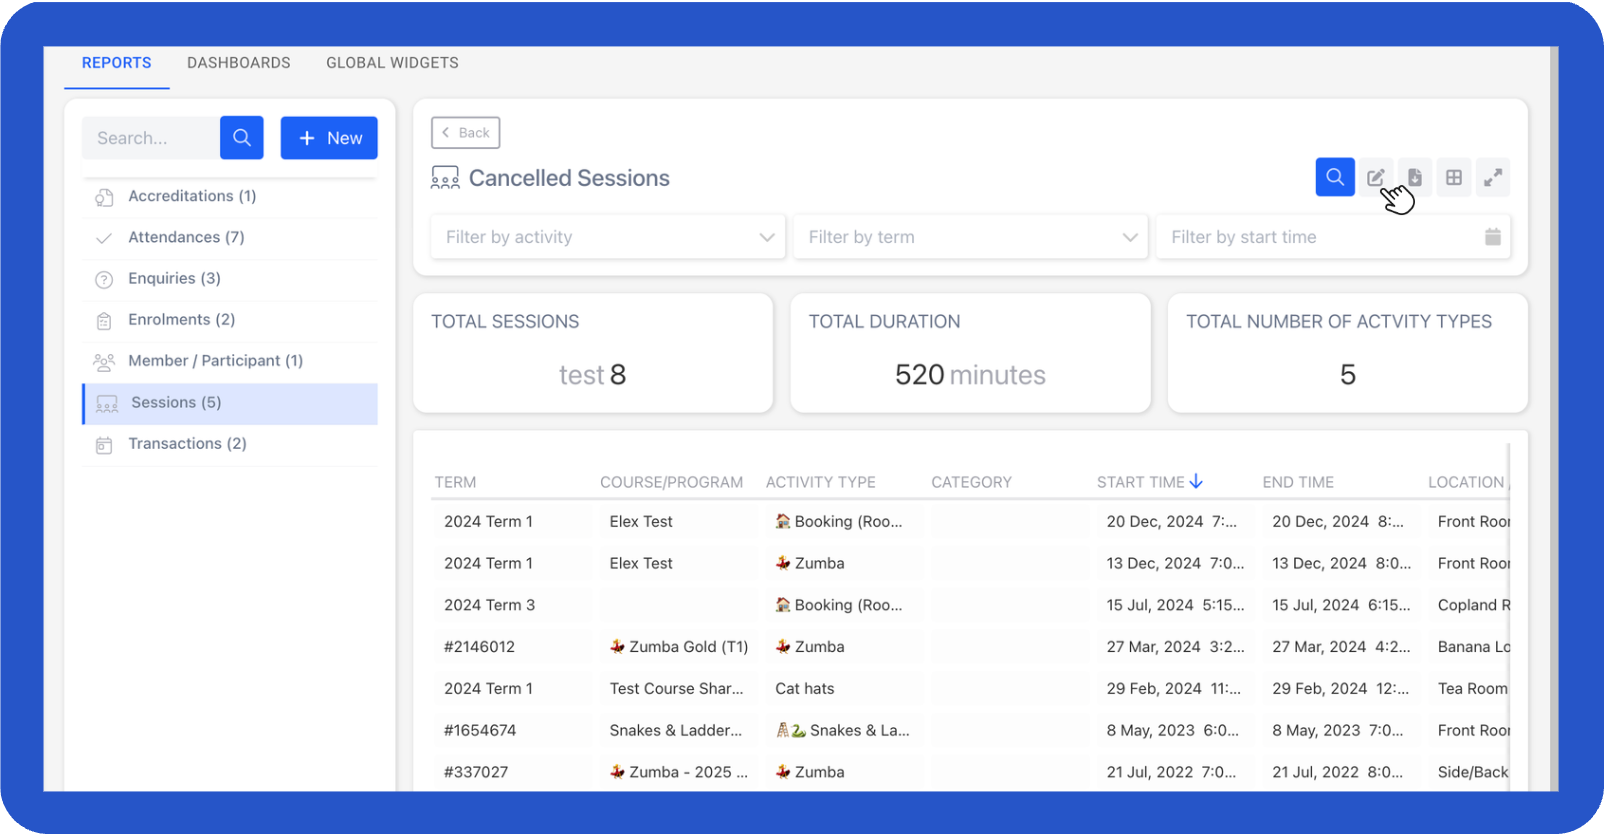
Duplicate or delete the layout as needed.
📌 Need Help?