Logs
✅ Record and analyse events with logs.
The Logs page provides a detailed deployment history, event logs, and associated details. It is a tool for tracking and analysing changes made during deployment.
Watch the guided demo below to access the Logs page.
You can also follow the same steps using the written guide below.
1. Accessing the Logs Page
There are two easy ways to access the Logs page. The first approach involves navigating through the system settings. Follow these steps:
- Click "Settings" and proceed to "System Settings".
- Select "Workflows" from the available options.
- Choose the "History" tab to access the Logs.
- Here, you will find a filter and a comprehensive list of all logs.
2. Filtering Options
The Logs store many deployment history data, capturing every action taken. We have provided useful filtering options to help you easily find the information you need.
These filters allow you to narrow down the log entries based on specific criteria:
| Criteria | Details |
|---|---|
| Deployment | Quickly find logs associated with a specific deployment, simplifying the tracking process. |
| Entry ID | Find a specific log entry using its unique identification, saving time when searching for important information. |
| Event ID | Use this filter to find logs related to a particular event ID, helping you investigate specific occurrences. |
| Event Type | Focus on logs that match specific event types like additions, edits, button triggers, or scheduled events. |
| Record | Filter logs to see only the ones related to a particular record, making it easier to focus on specific deployments. |
| Status | Choose a status filter to view logs of deployments that are queued, actively running, or already completed. |
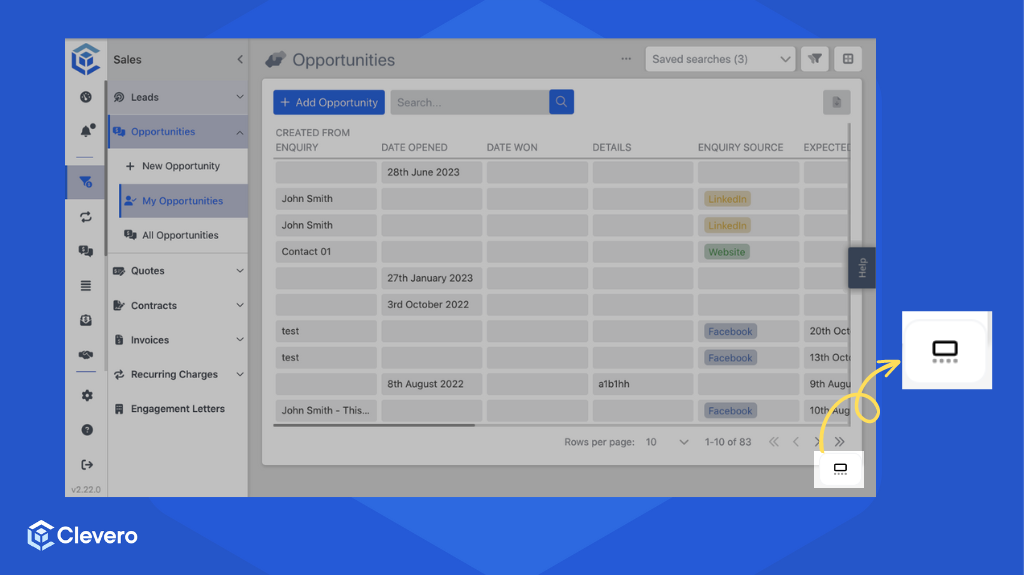
For a more user-friendly and efficient experience, we have designed a second method that ensures easy access to Logs anytime. Locate the icon at the bottom right corner of the system interface.
This icon remains accessible and visible as you explore different records and data. With just one click, you can instantly access the Logs, check the current deployment status, and monitor ongoing events.
3. Understanding the Log Entries
Each log entry provides valuable insights into the deployment process, enabling you to understand the events comprehensively.
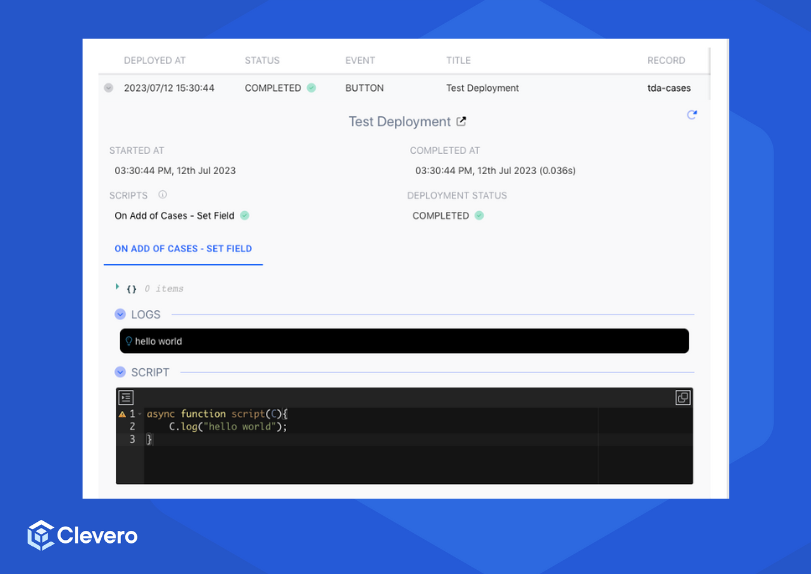
Let's break down the key fields that each log entry comprises:
- Timestamp (Started At & Completed At)
The timestamp indicates the date and time when the deployment started and was completed. It is a reference point for tracking the deployment's progress and duration.
- Deployment Status
The "Deployment Status" field presents the current state of the deployment. It can indicate whether the deployment is in the queue, active, or completed.
- Scripts
This section of the log entry offers information about the scripts executed during the deployment. Understanding the scripts involved is essential for troubleshooting and reviewing changes made.
- Logs
The log entry provides information about the event, including user details, role information, owner data, and event IDs. This detailed record helps you analyse the deployment process thoroughly and understand the specific actions taken during the event.
📌 Need Help?