Learn how to access the browser console on various web browsers for troubleshooting and debugging web applications.
| |
|---|
| Windows | Press Ctrl, Shift, and J simultaneously. |
| MacOS | Press Command (⌘), Option, and J simultaneously. |
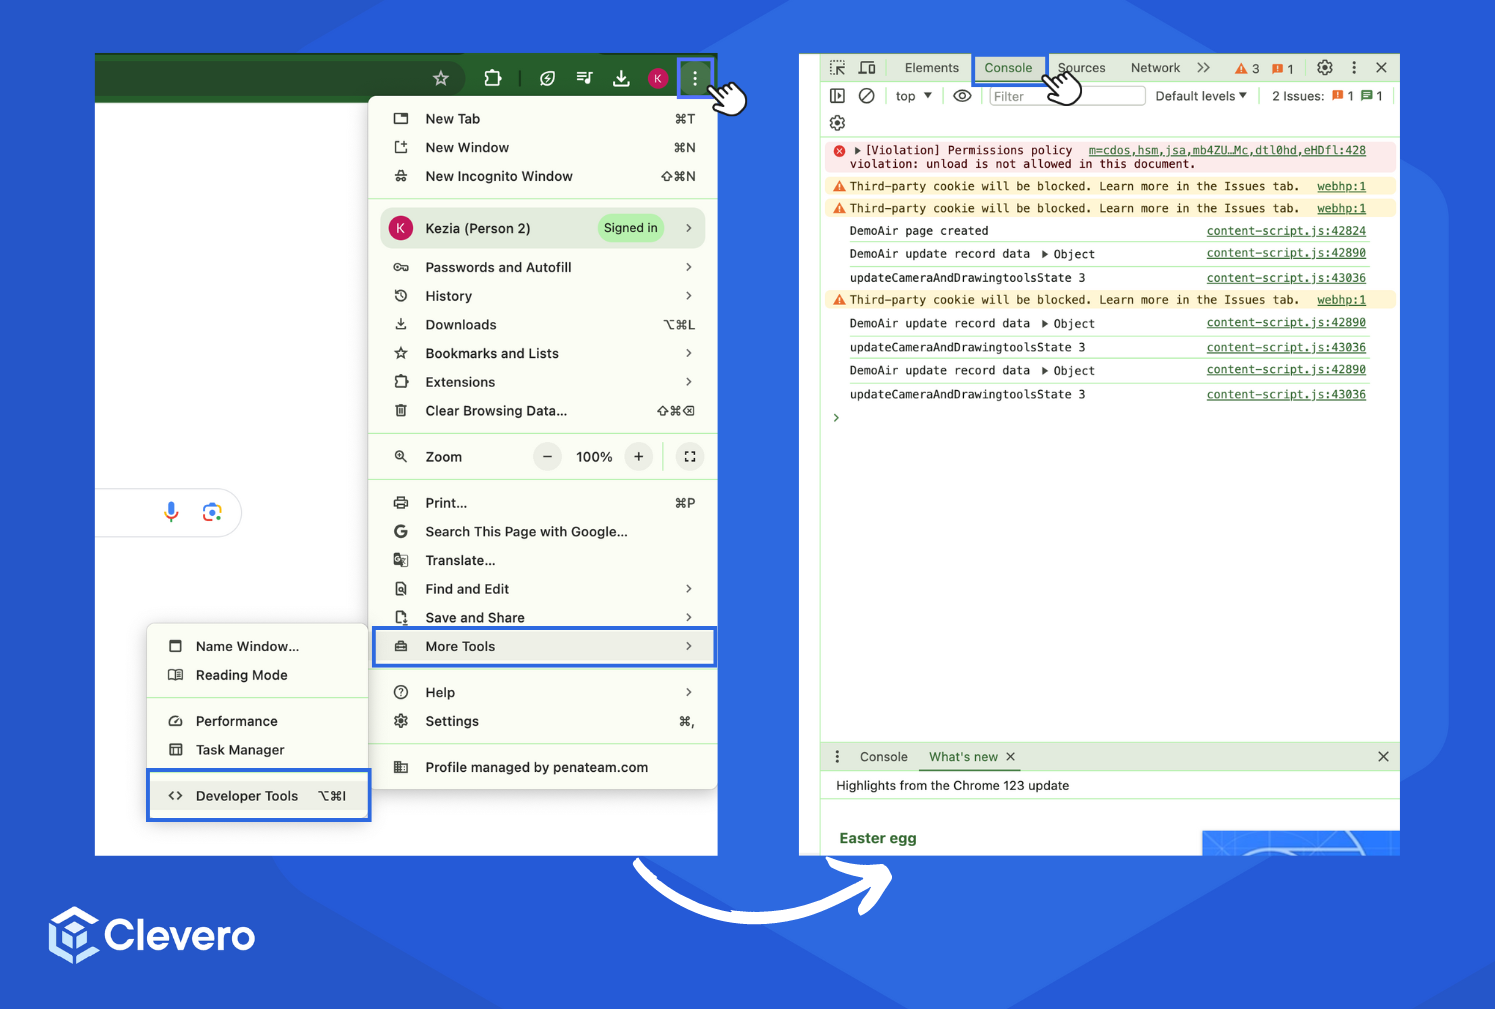
- Click on the three verticals in the top right-hand corner.
- Select "More tools".
- Select "Developer tools".
- Choose the "Console" tab from the Developer Tools window.
| |
|---|
| Windows | Press Ctrl, Shift, and J simultaneously. |
| MacOS | Press Command (⌘), Option, and J simultaneously. |
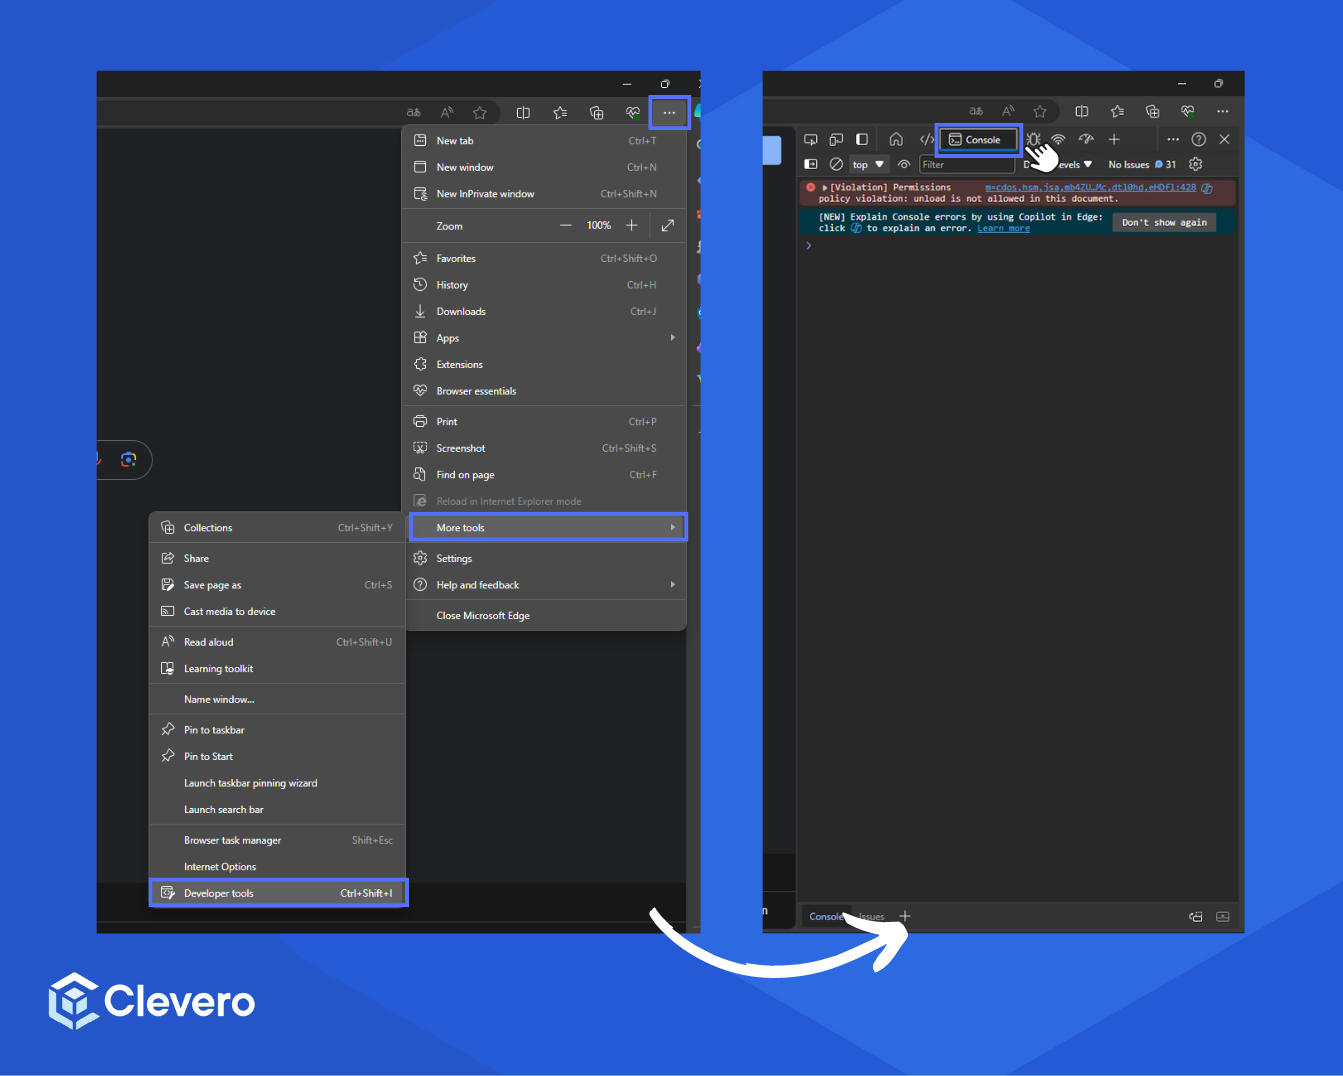
- Click on the three horizontal dots in the top right-hand corner.
- Select "More tools".
- Select "Developer tools".
- Choose the "Console" tab from the Developer Tools window.
| |
|---|
| Windows | Press Control, Shift, and K simultaneously. |
| MacOS | Press Command (⌘), Option, and K simultaneously. |
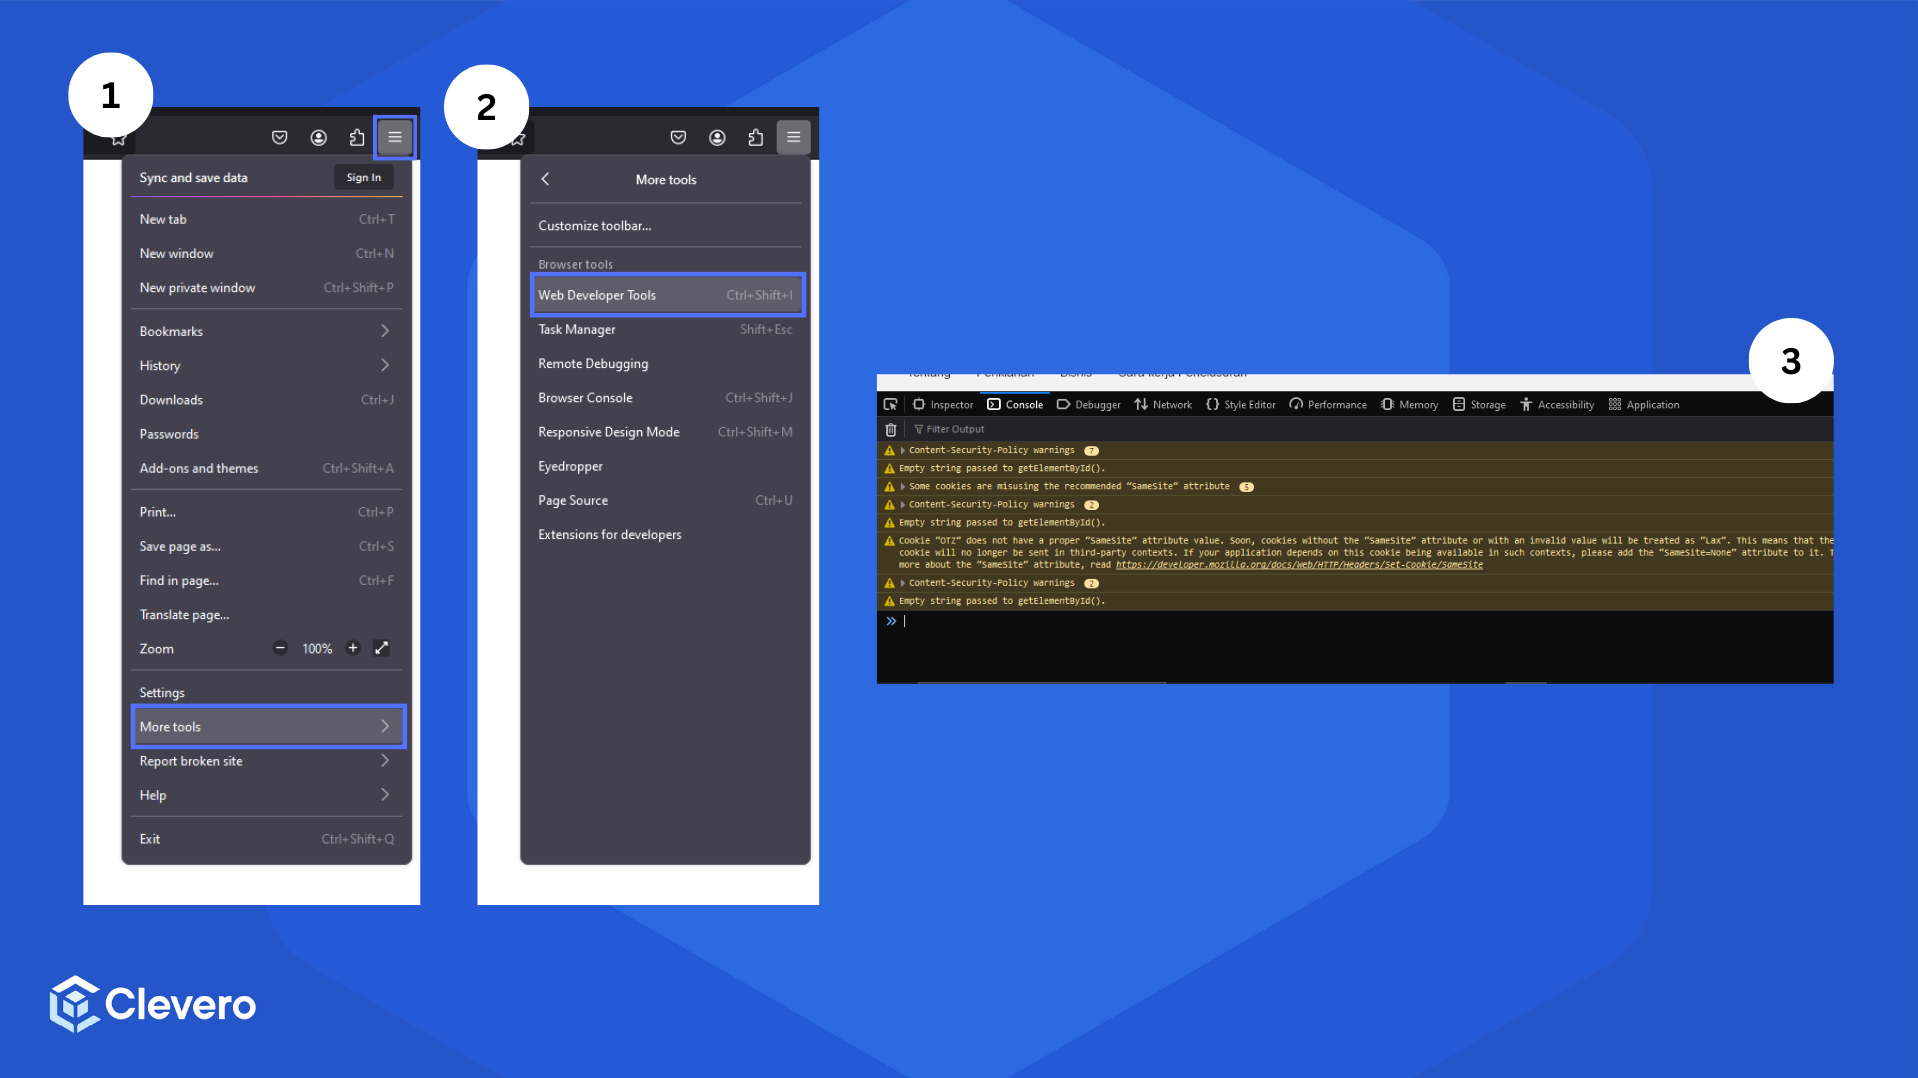
- Click on the three vertical lines in the top right-hand corner > Choose "More tools".
- Select "Web Developer Tools" from the menu.
- In the pop-up menu, choose "Console".
| |
|---|
| MacOS | Press Command (⌘), Option, and C simultaneously. |
- From the top left-hand corner of your screen, select "Safari".
- Choose "Settings..." from the drop-down menu.
- In the pop-up window, select the"Advanced" tab.
- Tick the checkbox of "Show features for web developers".
- Close the pop-up window.
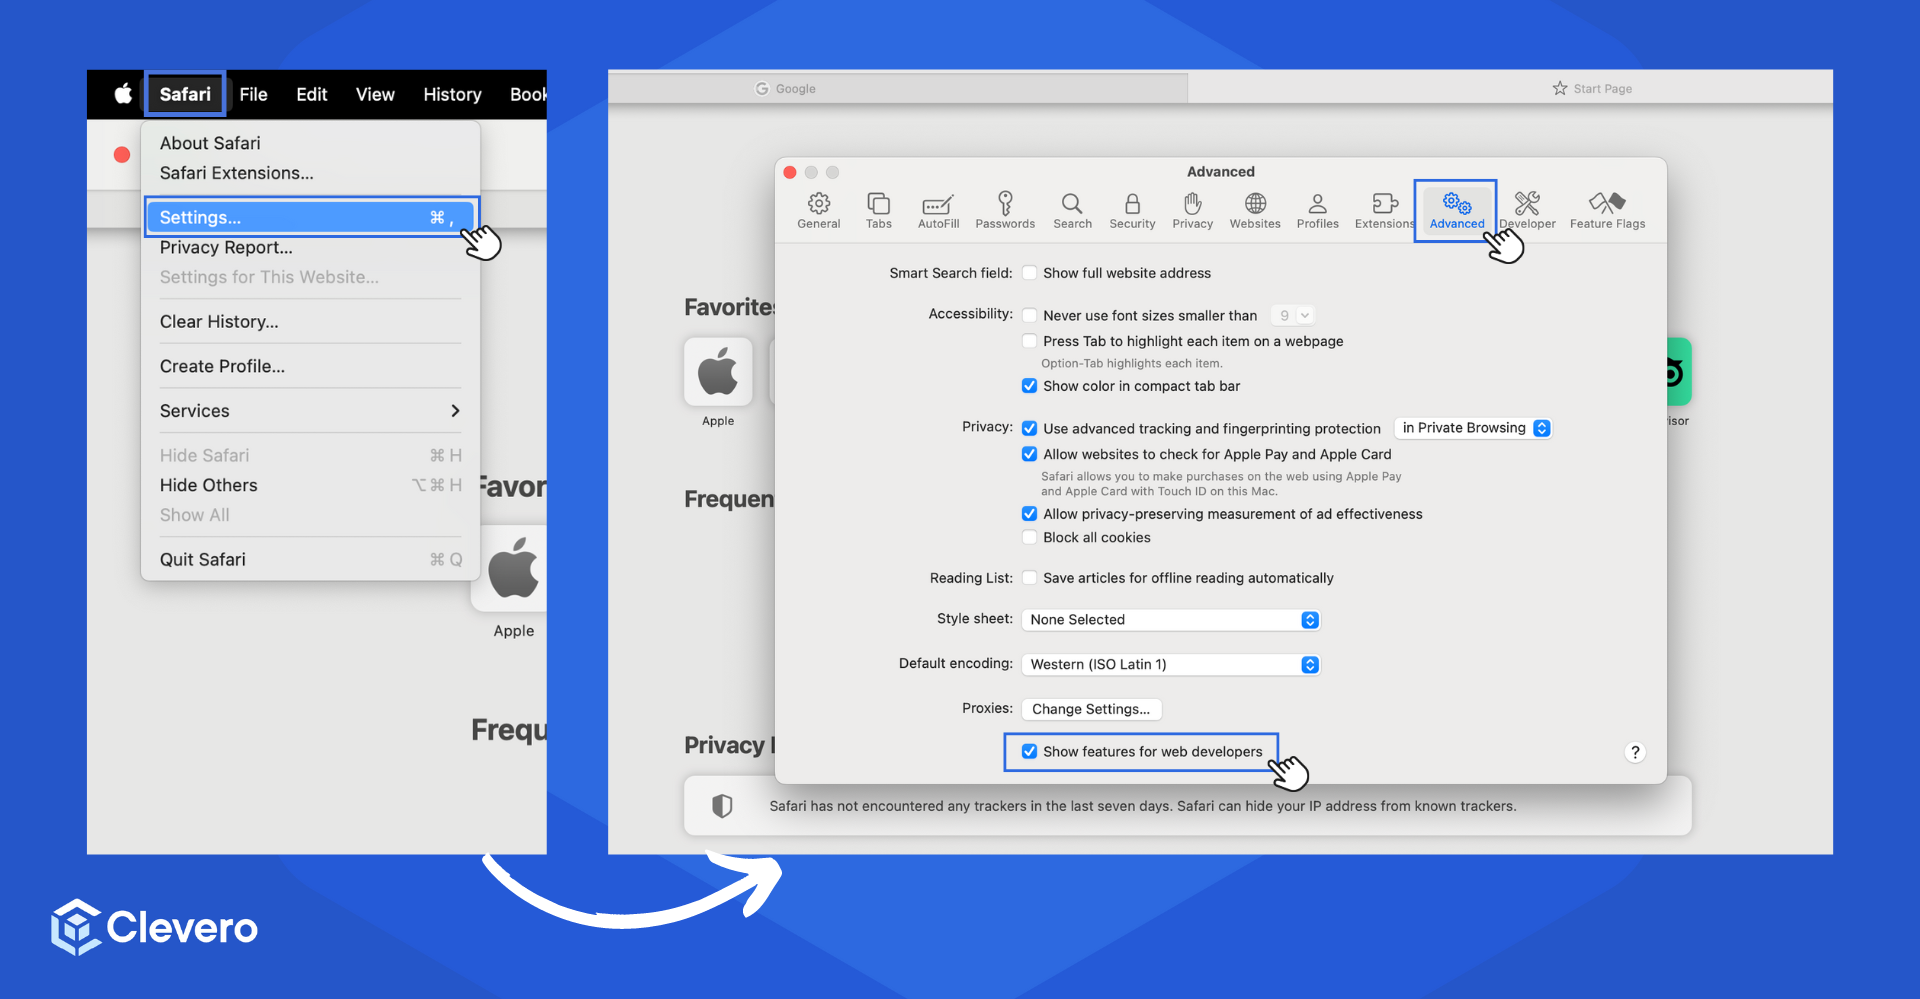
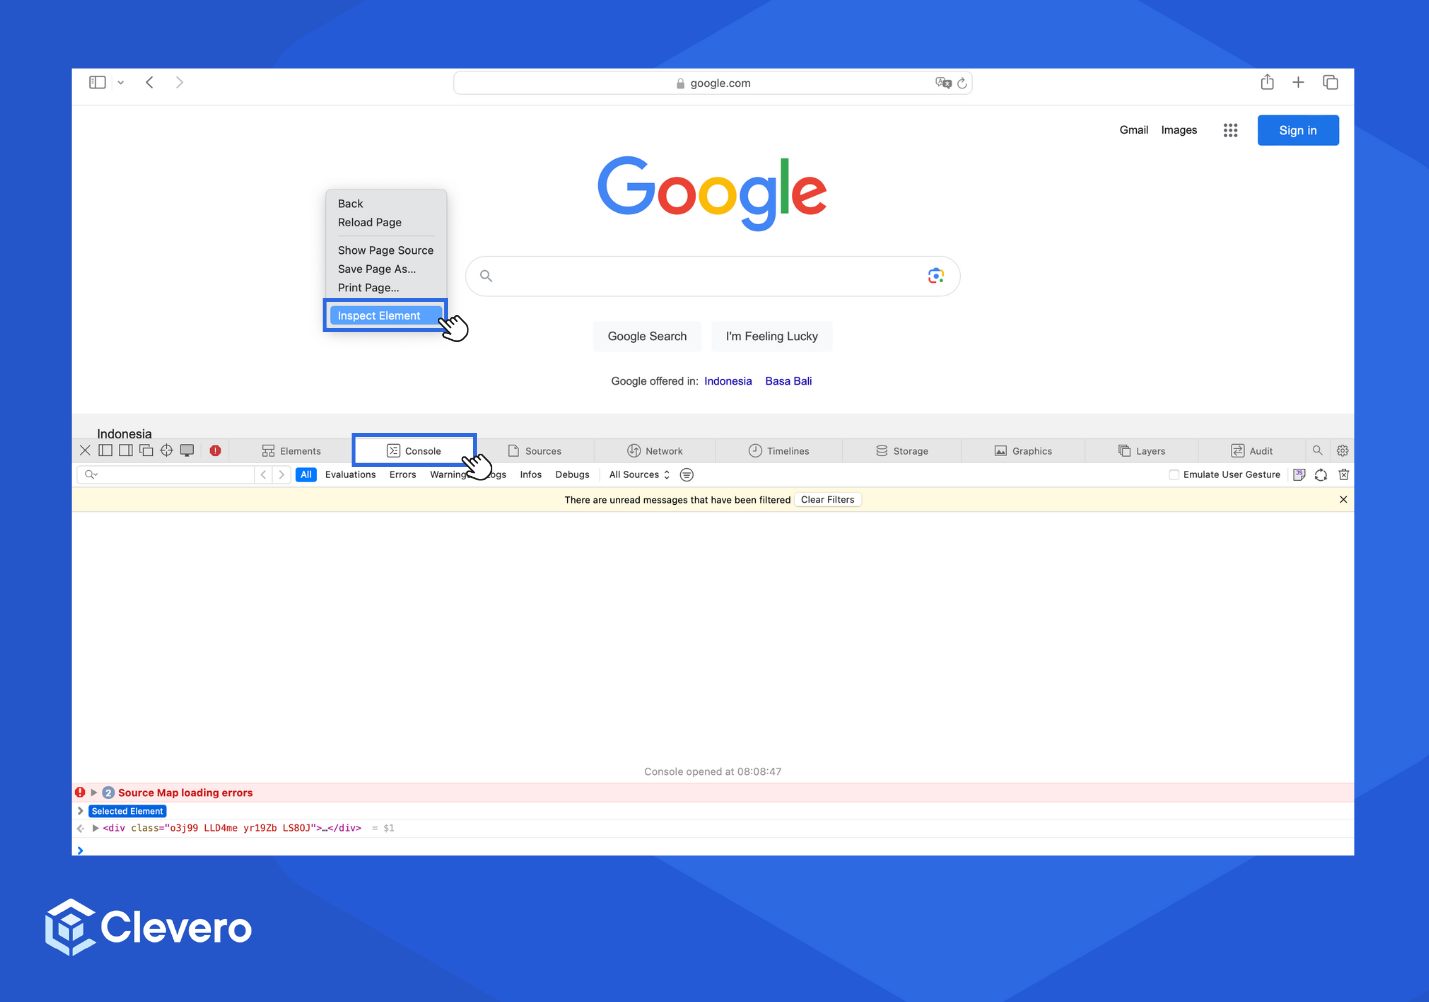
- Right-click on the page and press "Option" on the keyboard.
- Select "Inspect Element" from the menu.
- A new window will open. Choose the Console tab.

If you require assistance or encounter any issues, please don't hesitate to contact us for further support.